Forward modelling the
variable & energetic Universe
For the interpretation of the ensemble X-ray variability properties of AGN populations, a new model is developed that combines information from AGN demographics (i.e. the incidence of AGN in galaxies) with empirical relations that described the temporal variations of the AGN luminosity at different timescales (i.e. Power Spectral Density).
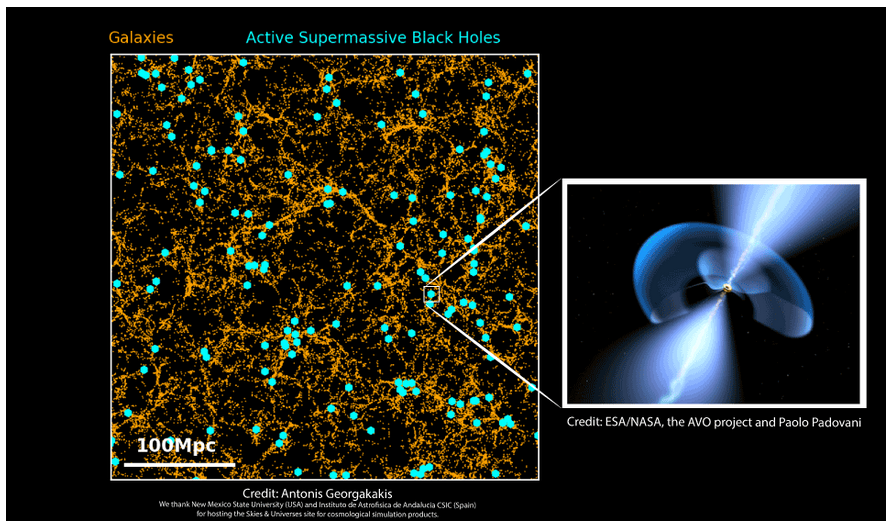
The demographics part of the modelling uses observationally derived relations on the incidence of AGN in galaxies. These quantify the probability of a galaxy hosting an accretion event on its supermassive black hole. Such empirical probabilities can be applied to (simulated) galaxies in a cosmological volume to stochastically assign accretion events to the population and hence paint, in a realistic manner, AGN on individual galaxies. This approach is becoming standard for generating mock AGN catalogues to interpret observations or make predictions that can help design future observational programmes.
The variability part of the modelling uses analytic parametrisations of the Power Spectral Density (PSD) of AGN. The PSD quantifies how large the brightness (or flux) variations of AGN around the mean are expected to be on different timescales. It is empirically found that the shape of the PSD depends on the mass of the black hole and the rate at which matter falls onto it (Eddington ratio). Lighter black holes or those that accrete matter at a slow rate show larger variations in their brightness. For a population of galaxies with supermassive black holes for which we know their masses and accretion rates (i.e. how fast matter falls into them), it is possible to simulate the flickering of the emitted radiation.
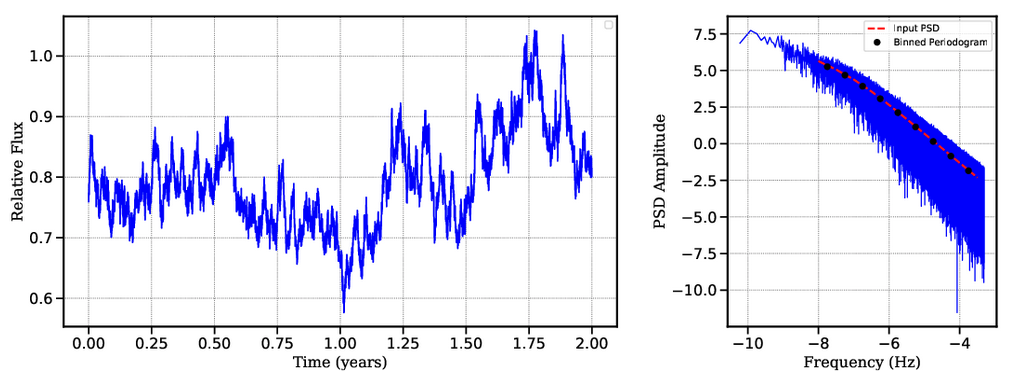
Demonstration of AGN flux variability. On the left panel, the blue curve is the simulated brightness (flux) variations of an AGN as a function of time (measured in years). The dips and peaks of the blue curve are the stochastic deviations of the emitted radiation relative to the mean. It shows that AGN flicker on different timescales. The panel on the right shows how these variations can be statistically quantified via the Power Spectral Density (PSD). This quantity measures how large are the brightness variations on the left panel on different timescales or frequencies. Larger values of the PSD correspond to larger variations at the corresponding timescale of frequency. The shape of the PSD, shown by the red curve and black datapoints, depends on the physical properties of the system, i.e. the mass of the black hole and the rate at which matter falls onto it. Knowledge of the PSD shape on the right allows predictions on the brightness flickering of AGN at different timescales.
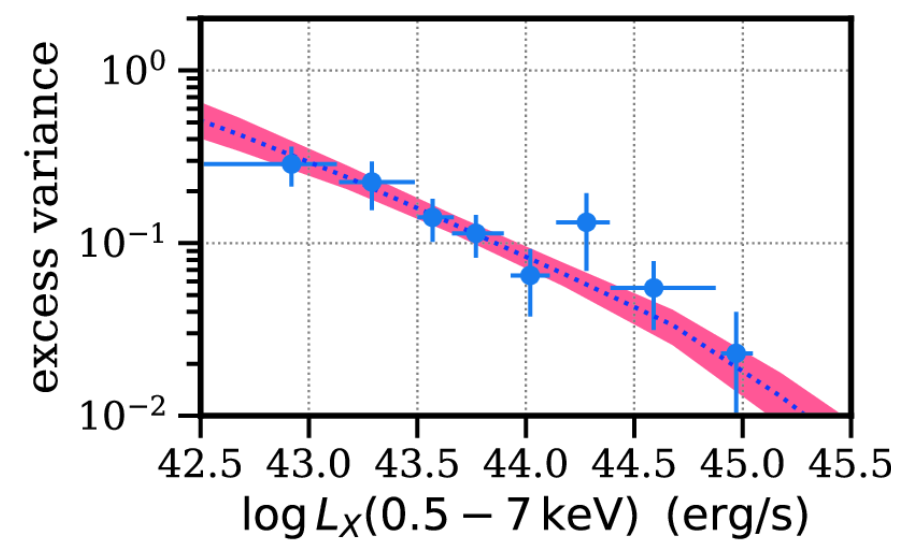
The combination of the empirical relations on demographics and variability allow the construction of mock Universes of AGN and galaxies that include the flickering of the radiation emitted by active supermassive black holes. Such simulations can then be used to interpret the average variability of AGN populations. For example the plot shows observations of the mean (ensemble) variability of a sample of AGN as a function of the accretion luminosity produced by the AGN. The model predictions are shown with the shaded regions. By fitting the model to such observations it is possible to constrain the input parameters of the model, for example, constrain the analytic forms that connect variability to physical quantities (black hole mass, accretion rate), or the scaling relations that connect black hole and galaxy (stellar) masses.